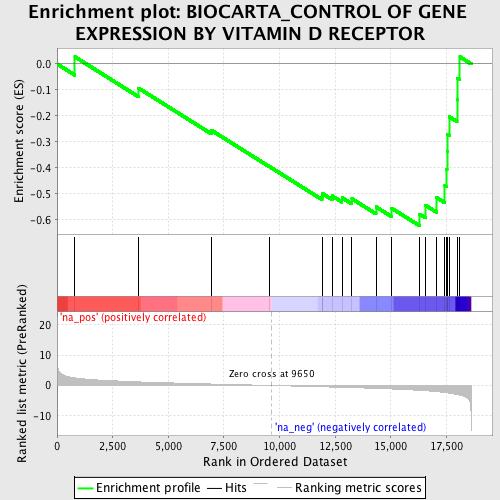
Profile of the Running ES Score & Positions of GeneSet Members on the Rank Ordered List
| Dataset | set04_transDMproB_versus_LMproB |
| Phenotype | NoPhenotypeAvailable |
| Upregulated in class | na_neg |
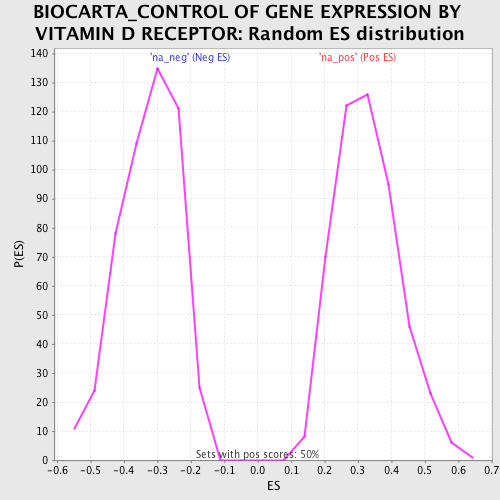
| GeneSet | BIOCARTA_CONTROL OF GENE EXPRESSION BY VITAMIN D RECEPTOR |
| Enrichment Score (ES) | -0.6230223 |
| Normalized Enrichment Score (NES) | -1.9086387 |
| Nominal p-value | 0.0 |
| FDR q-value | 0.051110256 |
| FWER p-Value | 0.351 |
| PROBE | GENE SYMBOL | GENE_TITLE | RANK IN GENE LIST | RANK METRIC SCORE | RUNNING ES | CORE ENRICHMENT | |
|---|---|---|---|---|---|---|---|
| 1 | SMARCD1 | 803 | 2.488 | 0.0273 | No | ||
| 2 | RXRA | 3660 | 1.180 | -0.0929 | No | ||
| 3 | SNW1 | 6929 | 0.490 | -0.2547 | No | ||
| 4 | NCOA3 | 9539 | 0.025 | -0.3943 | No | ||
| 5 | TOP2B | 11908 | -0.425 | -0.5096 | No | ||
| 6 | HDAC1 | 11922 | -0.428 | -0.4982 | No | ||
| 7 | COPS2 | 12361 | -0.511 | -0.5073 | No | ||
| 8 | NCOA1 | 12805 | -0.599 | -0.5142 | No | ||
| 9 | SUPT16H | 13252 | -0.693 | -0.5185 | No | ||
| 10 | PRMT1 | 14335 | -0.956 | -0.5496 | No | ||
| 11 | NCOA2 | 15031 | -1.143 | -0.5546 | No | ||
| 12 | ARID1A | 16304 | -1.584 | -0.5782 | Yes | ||
| 13 | SMARCC1 | 16556 | -1.705 | -0.5434 | Yes | ||
| 14 | ACTL6A | 17056 | -2.001 | -0.5135 | Yes | ||
| 15 | CARM1 | 17430 | -2.309 | -0.4682 | Yes | ||
| 16 | VDR | 17518 | -2.394 | -0.4051 | Yes | ||
| 17 | CHAF1A | 17527 | -2.403 | -0.3375 | Yes | ||
| 18 | CREBBP | 17538 | -2.415 | -0.2696 | Yes | ||
| 19 | NCOR1 | 17634 | -2.517 | -0.2034 | Yes | ||
| 20 | SMARCA4 | 17976 | -2.947 | -0.1383 | Yes | ||
| 21 | TSC2 | 17983 | -2.955 | -0.0549 | Yes | ||
| 22 | SMARCE1 | 18108 | -3.139 | 0.0273 | Yes |